TL;DR: In a web server access log, an attack shows up as a pattern, not a single line: one client sending dozens of requests a second, a spike of 500 errors on one endpoint, the same URL answered with two alternating response sizes, or requests that are suddenly seconds slower than their neighbours. Decode the URL before you search it for SQL, and add the request time to your log format, because a blind time-based probe looks like a normal 200 in every other field.
This is for anyone who runs a site or app and has never read its access log with an attacker in mind. We set up a small lab on our own machine, ran two common scanners against it, and then read the log they left. By the end you will know what each field of a log line can and cannot tell you, and you will have a handful of commands to run against your own logs. Only scan targets you own or have written permission to test; the lab below runs on localhost.
What does an attack look like in an access log?
It looks like volume and repetition from one source, aimed at a small number of paths, with error codes and response sizes that a person browsing would never produce. A single suspicious line proves little; a scanner leaves hundreds of lines that share a client, a user agent and a rhythm.
Most web servers write one line per request in the combined log format. nginx defines it as $remote_addr - $remote_user [$time_local] "$request" $status $body_bytes_sent "$http_referer" "$http_user_agent" and uses it by default (nginx ngx_http_log_module); Apache's combined format records the same fields (Apache HTTP Server log files). So every command below works on either, as long as the format has not been customised.
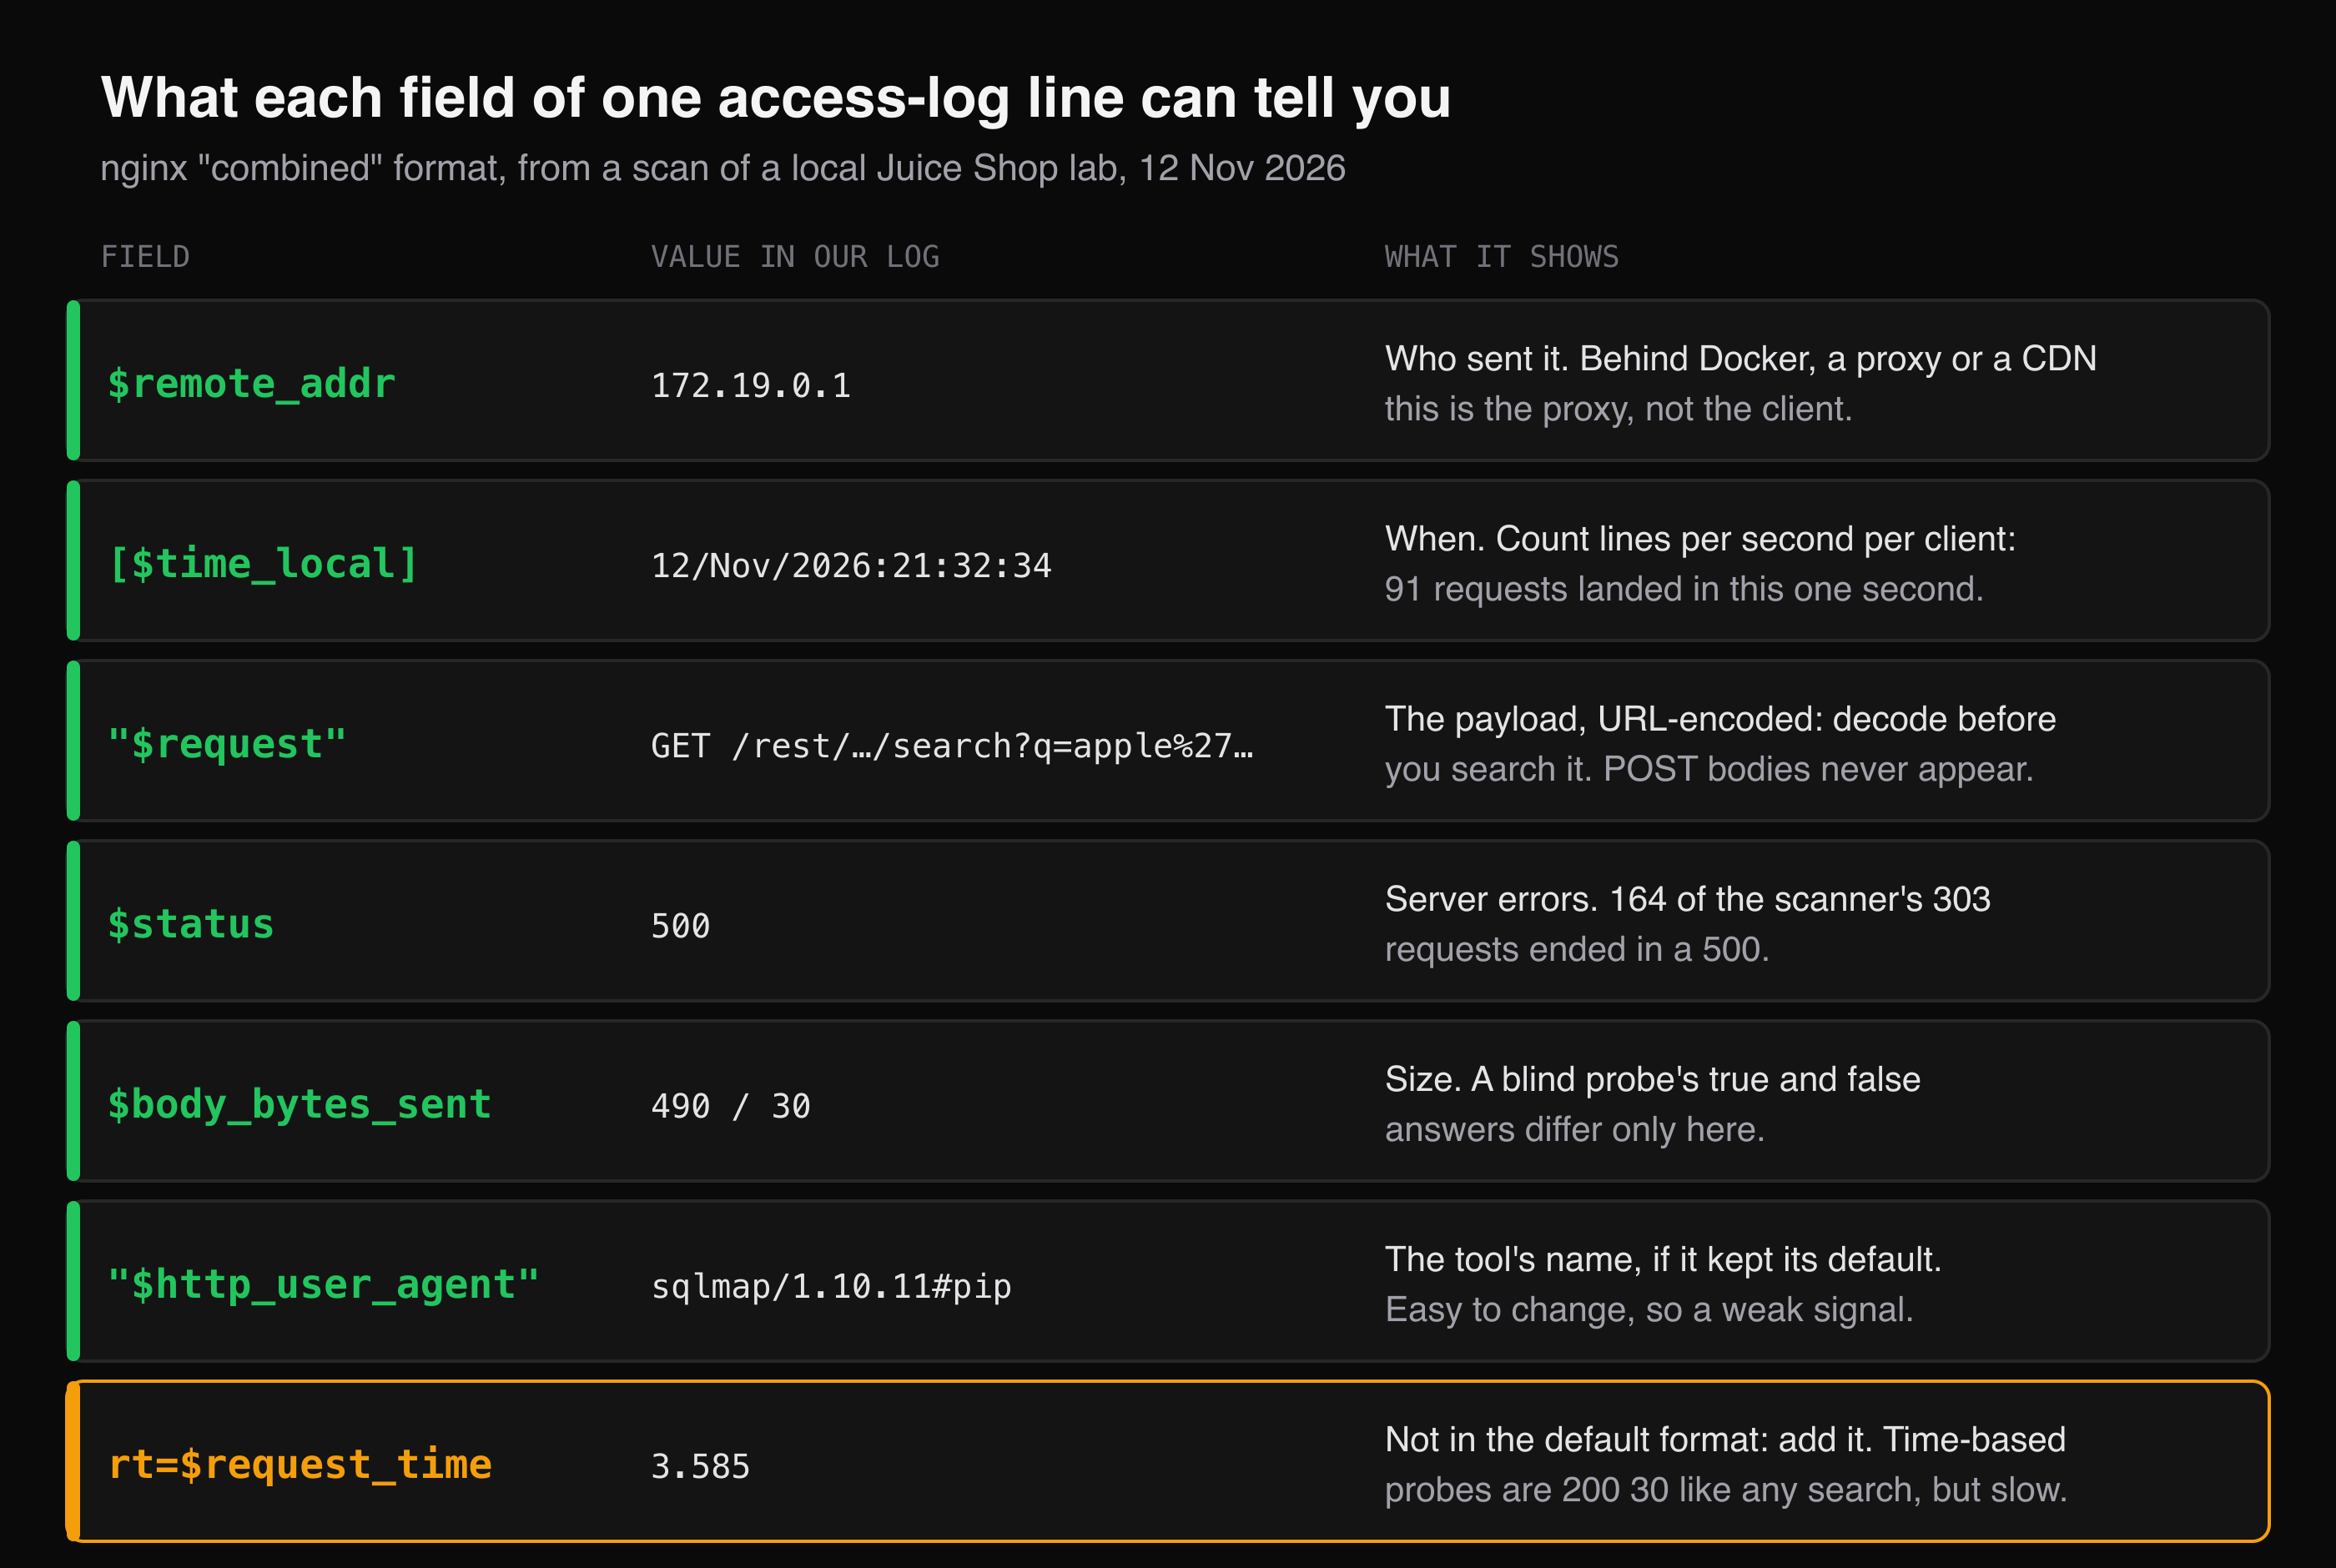 One line, seven fields. The last one is not in the default format; adding it is the most useful change in this article.
Two things are missing from that format, and both matter. The request body is never logged, so anything sent in a POST or a JSON payload leaves only its path and status behind. And the response time is not there by default, which hides the one signal that gives away blind time-based injection.
How we produced a log worth reading
We ran OWASP Juice Shop, the deliberately vulnerable app that CyberGym is built on, in Docker behind an nginx reverse proxy. CyberGym is the place to practise attacks, but you cannot read its server logs; to see the defender's side you need a copy whose logs are yours. The lab, on 12 November 2026: Juice Shop 20.4.0-SNAPSHOT (the latest image), nginx 1.30.6.
mkdir -p lab/logs && cd lab
cat > nginx.conf <<'EOF'
events {}
http {
  access_log /var/log/nginx/access.log combined;
  server {
    listen 80;
    location / { proxy_pass http://juice:3000; }
  }
}
EOF
docker network create lab
docker run -d --name juice --network lab bkimminich/juice-shop
docker run -d --name proxy --network lab -p 127.0.0.1:8080:80 \
  -v "$PWD/nginx.conf:/etc/nginx/nginx.conf:ro" \
  -v "$PWD/logs:/var/log/nginx" nginx:stable
Then three kinds of traffic, in order:
- A person browsing: eight ordinary page and API requests with a browser user agent, and later two logins, one with a wrong password and one with a stray quote in the email field.
- A content scan: ffuf with a 41-word list of paths such as
/admin,/.envand/backup. - SQL injection probes: sqlmap against the product search,
/rest/products/search?q=apple, first with defaults, then with--level 3 --risk 2 --dbms sqlite, then restricted to time-based tests.
ffuf -u http://127.0.0.1:8080/FUZZ -w words.txt -mc 200,204,301,302,307,401,403 -fs 9984
sqlmap -u 'http://127.0.0.1:8080/rest/products/search?q=apple' -p q --batch
sqlmap -u 'http://127.0.0.1:8080/rest/products/search?q=apple' -p q --batch --level 3 --risk 2 --dbms sqlite --flush-session
words.txt is a plain list of path names, one per line; -fs 9984 hides responses the size of the app's front page. The default sqlmap run reported that q "does not seem to be injectable". The second run, at a higher level, found boolean-based, error-based and time-based injection against SQLite. That difference matters for a defender: the log records the attempt whether or not the tool succeeded, and both runs left hundreds of lines. The finished log had 354 lines.
How do I find scanners in my access log?
Count requests per user agent, per status code and per client per second; a scanner stands out on all three within the first minute. These are the commands, run on our log, with their real output.
Who was talking:
awk -F'"' '{print $6}' access.log | sort | uniq -c | sort -rn
 303 sqlmap/1.10.11#pip (https://sqlmap.org)
  41 Fuzz Faster U Fool v2.1.0-dev
  10 Mozilla/5.0 (Macintosh; Intel Mac OS X 10_15_7) AppleWebKit/537.36 (KHTML, like Gecko) Chrome/130.0.0.0 Safari/537.36
Both tools announced themselves. Do not rely on it: sqlmap's --random-agent switch replaces its default user agent with one picked from a list of browser strings (sqlmap usage), and ffuf accepts any header you give it. A user agent is a hint, never the evidence.
What the server answered:
awk '{print $9}' access.log | sort | uniq -c | sort -rn
 183 200
 169 500
   1 401
   1 301
Nearly half the requests ended in a server error. A healthy app throws an occasional 500; 169 of them in two minutes, 164 from one user agent, is the clearest signal in the whole log. The other side of it: each of those 500s is the app failing on input it did not expect, which is worth fixing whoever sent it.
How fast:
awk '{print $1, substr($4, 2)}' access.log | sort | uniq -c | sort -rn | head -5
  91 172.19.0.1 12/Nov/2026:21:32:34
  82 172.19.0.1 12/Nov/2026:21:32:16
  39 172.19.0.1 12/Nov/2026:21:33:09
  23 172.19.0.1 12/Nov/2026:21:32:06
  22 172.19.0.1 12/Nov/2026:21:32:26
Ninety-one requests from one address in one second. Nobody clicks that fast. The address itself is a lesson: every line in our log says 172.19.0.1, Docker's gateway, because the requests arrived through a published port. Behind a load balancer or a CDN you get the same effect: $remote_addr is the proxy, and every attacker looks like the same client. nginx's realip module fixes that with set_real_ip_from (the proxy addresses you trust) and real_ip_header (the header that carries the client's address). Set it up before you need it.
What does a content scan look like in the logs?
A content scan is a burst of requests for paths that do not exist on your site, usually well-known names from a wordlist, sent faster than a person could type them. Ours sent 41 requests in two seconds, for /.env, /.git/HEAD, /wp-admin, /phpmyadmin and the like. MITRE ATT&CK lists this as wordlist scanning, a form of active reconnaissance.
The surprise was the status codes. Juice Shop is a single-page app, so for a path it does not know it returns its own front page with a 200. Grouping by status and size shows it:
awk '{print $9, $10}' access.log | sort | uniq -c | sort -rn | head -5
 111 500 994
  83 200 30
  56 200 490
  29 200 3257
  25 500 986
awk '$9 == 200 && $10 == 3257 {print $7}' access.log | head -8
/old
/b2b
/.git/HEAD
/console
/sitemap.xml
/admin
/server-status
/wp-admin
Twenty-nine different paths, one identical response size. That is the app's fallback page, not 29 files. A 200 in the log does not mean a file was there, so when you check whether a scan "found" something, compare response sizes, not status codes. The few paths that came back with a different size — /ftp, /encryptionkeys, /support/logs, /metrics — are the ones to look at, and each of them is a known Juice Shop exposure. If your own scan turns up paths like those, our article on exposed backup files covers what to do with them.
How do I detect SQL injection in my logs?
Decode the URL first, then search the request path and query for SQL fragments, and group the hits by client, endpoint and status. Searching the raw log finds nothing, because the payload is URL-encoded:
grep -ciE "union select|' or 1=1" access.log
0
Zero, in a log with 303 sqlmap requests. Here is what one of them looks like before and after decoding:
GET /rest/products/search?q=apple%25%27%20AND%204743%3D4743%20AND%20%27bFFD%25%27%3D%27bFFD
GET /rest/products/search?q=apple%' AND 4743=4743 AND 'bFFD%'='bFFD
This short script parses each combined-format line, decodes the URL and counts lines that contain common injection fragments:
import re
import sys
from collections import Counter
from urllib.parse import unquote_plus

# One line of the nginx/Apache "combined" format.
LINE = re.compile(r'(\S+) \S+ \S+ \[([^\]]+)\] "(\S+) (\S+)[^"]*" (\d{3}) (\S+) "[^"]*" "([^"]*)"')
# Fragments that turn up in SQL injection probes, matched after URL-decoding.
SQLI = re.compile(
    r"union\s+(all\s+)?select|\b(and|or)\s+\d+\s*=\s*\d+|sleep\s*\(|"
    r"randomblob\s*\(|information_schema|'\s*(--|#)",
    re.IGNORECASE,
)

hits = Counter()
for raw in open(sys.argv[1], encoding="utf-8", errors="replace"):
    m = LINE.match(raw)
    if not m:
        continue
    ip, when, method, url, status, size, agent = m.groups()
    if SQLI.search(unquote_plus(url)):
        hits[(ip, method, url.split("?")[0], status)] += 1

for (ip, method, path, status), n in hits.most_common():
    print(f"{n:5}  {ip}  {method} {path}  -> {status}")
python3 find_sqli.py access.log
  128  172.19.0.1  GET /rest/products/search  -> 500
   68  172.19.0.1  GET /rest/products/search  -> 200
It flagged 196 lines, all on one endpoint, and none of the ten browser requests. It also missed 107 of sqlmap's 303, because not every probe contains a keyword: sqlmap's first test sends junk such as 'gbNweG<'">)qdzpcd just to see whether the app breaks. That is the honest limit of signature matching. The list catches the common shapes, an attacker can write around it, and the 500 spike and the request rate catch what the list misses. Use all three together.
The two outputs tell you different things. The 128 that ended in a 500 show that the input reached something that failed on it. The 68 that ended in a 200 are the ones to read closely, because a working injection usually comes back as a normal response.
What do blind SQL injection probes look like?
They look like ordinary requests that differ only in size or in time. Boolean-based blind injection asks the database a yes-or-no question and reads the answer from the response; in the log, that is the same endpoint answered with two alternating sizes. These three consecutive lines from our log are a false, a true and a false condition:
[12/Nov/2026:21:32:26 +0000] "GET /rest/products/search?q=apple%25%27%20AND%206098%3D3687%20AND%20%27Zija%25%27%3D%27Zija HTTP/1.1" 200 30
[12/Nov/2026:21:32:26 +0000] "GET /rest/products/search?q=apple%25%27%20AND%204743%3D4743%20AND%20%27bFFD%25%27%3D%27bFFD HTTP/1.1" 200 490
[12/Nov/2026:21:32:26 +0000] "GET /rest/products/search?q=apple%25%27%20AND%204036%3D1358%20AND%20%27byIw%25%27%3D%27byIw HTTP/1.1" 200 30
6098=3687 is false and the search returns 30 bytes, an empty result. 4743=4743 is true and it returns 490 bytes, exactly what a plain search for apple returns. The database evaluated the attacker's condition. To a status-code dashboard all three lines are healthy 200s; the size column is where the injection shows. The query-side explanation of why this works is in our SQL injection example.
Time-based blind injection hides even better. The probe makes the database do slow work when a condition is true, and reads the answer from the delay. In the combined format there is no delay to see, so we added nginx's $request_time, the time from the first byte read from the client to the log write after the response was sent (nginx ngx_http_log_module), and ran the time-based tests again:
log_format timed '$remote_addr - $remote_user [$time_local] "$request" '
                 '$status $body_bytes_sent "$http_referer" "$http_user_agent" '
                 'rt=$request_time';
access_log /var/log/nginx/timed.log timed;
awk -F'rt=' '$2 > 1' timed.log | awk '{print $4, $9, $10, $NF}' | head -3
[12/Nov/2026:21:33:13 200 30 rt=3.585
[12/Nov/2026:21:33:16 200 30 rt=3.576
[12/Nov/2026:21:33:20 200 30 rt=3.568
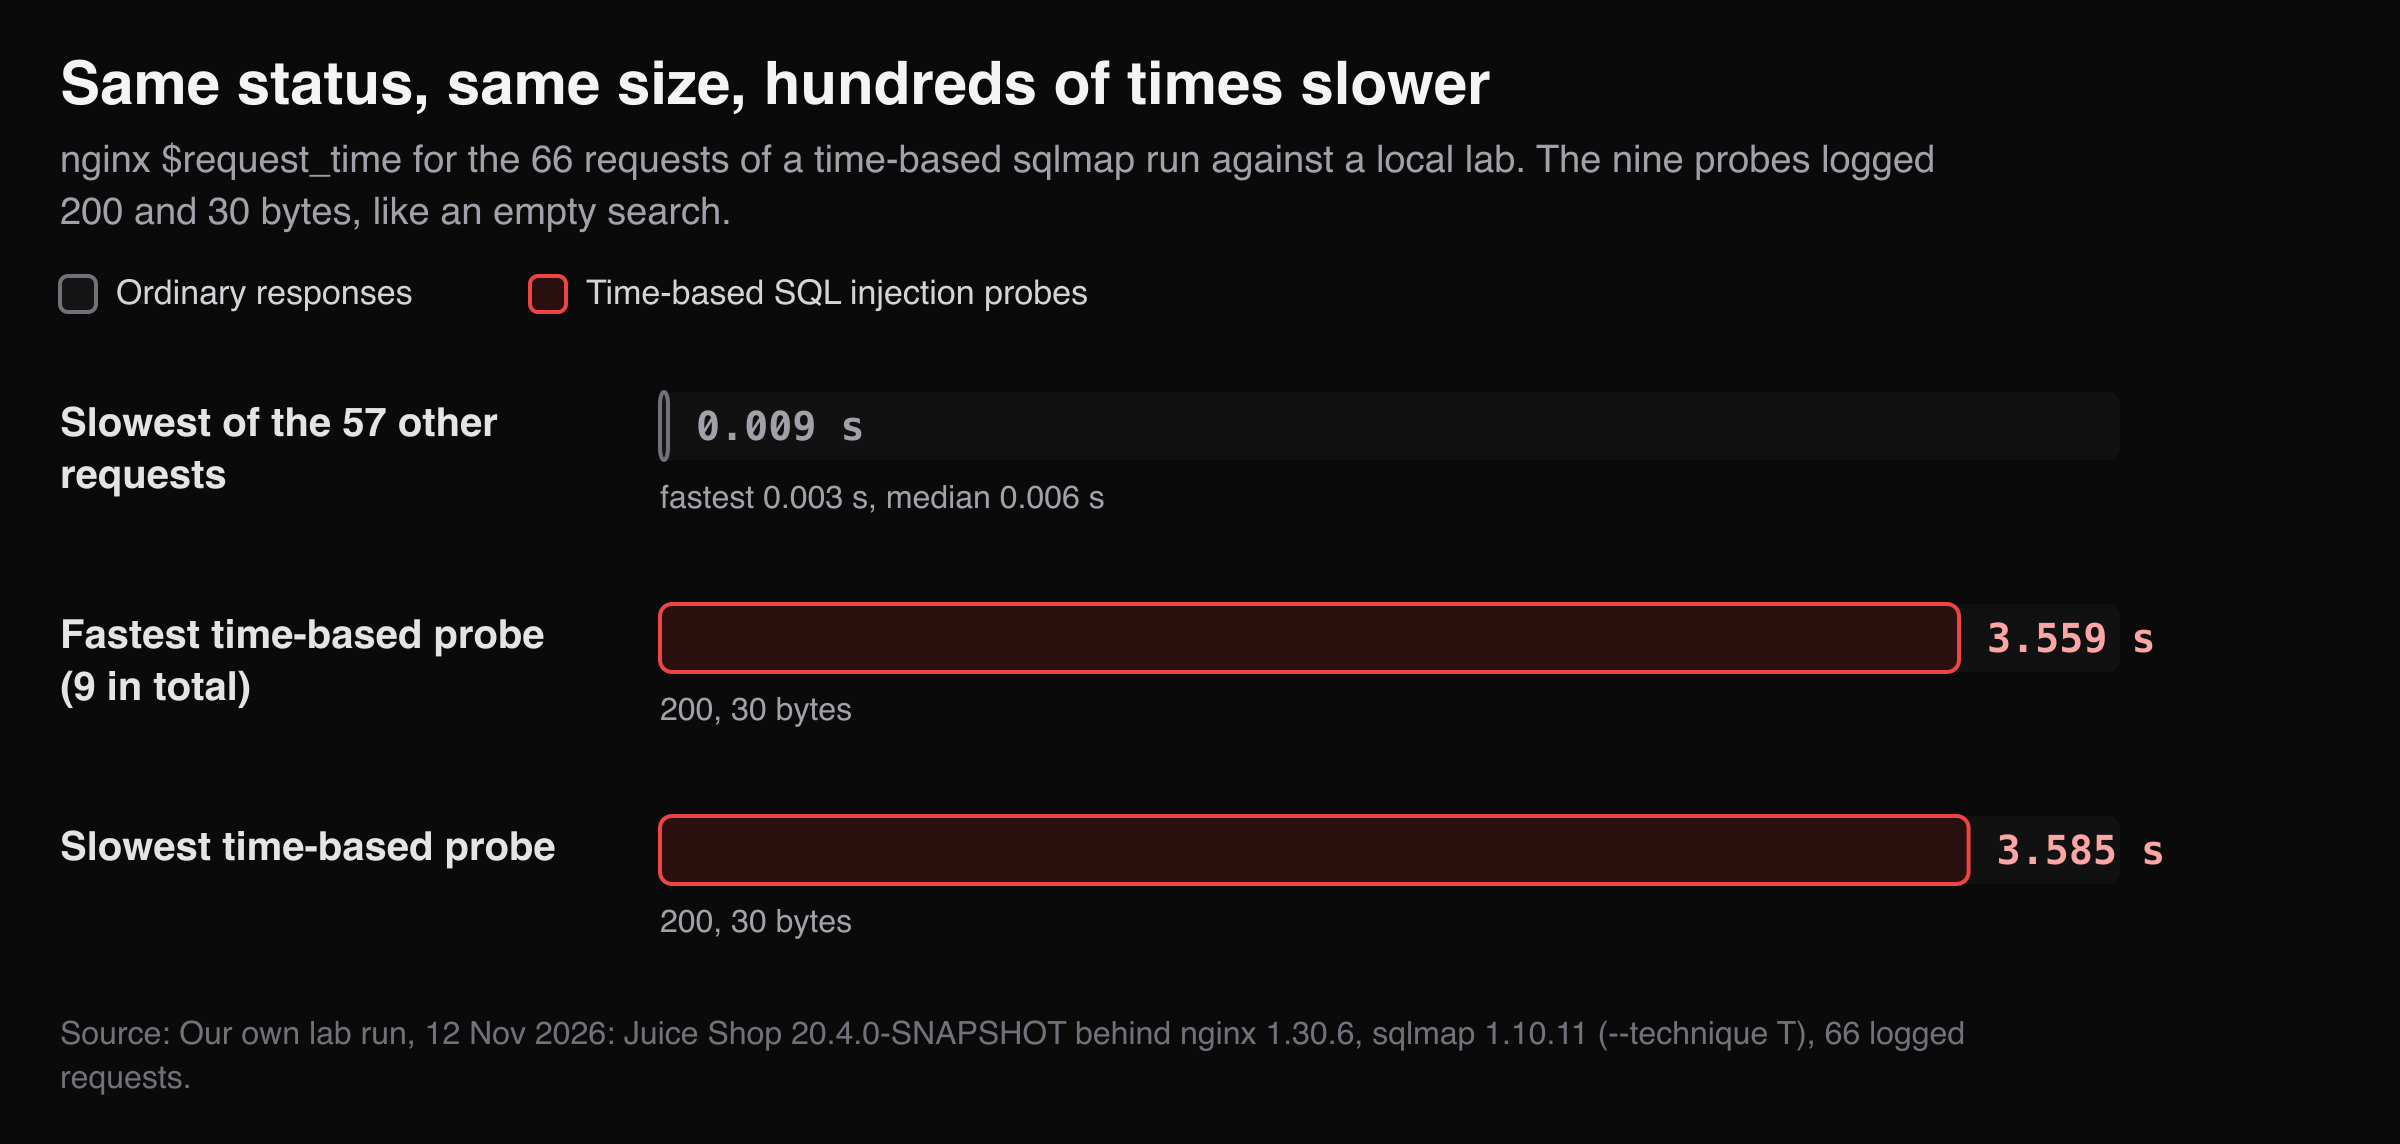 Status and size could not tell these nine requests apart from an empty search. Response time could.
Nine probes, each 200 with 30 bytes, the same as an empty search. Each took about 3.6 seconds; the other 57 requests in that run took between 0.003 and 0.009 seconds. Without the timing field those nine lines are indistinguishable from someone searching for a product that does not exist. Apache records the same thing with %D (microseconds) or %T (seconds) in its format string (Apache mod_log_config).
What can't an access log show?
It cannot show anything in a request body. Our two login attempts, one with a wrong password and one with a quote in the email field, left these lines:
"POST /rest/user/login HTTP/1.1" 401 26
"POST /rest/user/login HTTP/1.1" 500 1461
The payload is gone. All the log says is that one login failed politely and the other broke the server. On an app whose forms post JSON, most injection attempts will look like this, and a 500 on a login endpoint is the only trace. That is a reason to log application errors with enough context to investigate, which the OWASP Logging Cheat Sheet covers, without writing passwords, tokens or session ids into any log.
It also cannot tell you whether an attack succeeded. Our log showed a confirmed boolean-based injection only because we knew what a normal search returns. On a real site you read the log to find where to look, then confirm in the code.
What should I do with what I find?
Treat a match as a lead to an endpoint, not as a verdict on a client. The useful output of log analysis is "the product search throws 500s on a quote and answers differently to true and false conditions", and that is a bug to fix in the query, whoever sent the requests.
- Add the timing field today.
$request_timein nginx,%Din Apache. It costs one line of configuration and is the only field that shows time-based probes. - Get the real client address. Configure
set_real_ip_fromandreal_ip_headerif anything sits in front of your server, or every client looks like your proxy. - Alert on patterns, not keywords. A client with dozens of 500s, a path answered with alternating sizes, a normally fast endpoint taking seconds. OWASP renamed its logging category for 2025 to Security Logging and Alerting Failures to put the weight on the alerting that makes someone act on a log event.
- Fix the endpoint, not the log line. Parameterized queries are the primary defence (OWASP SQL Injection Prevention Cheat Sheet). Blocking a user agent or an address stops one client for one afternoon.
- Read your own tests from this side. After you scan your own site, as in how to pentest your own website, open the log and find your scan in it. If you cannot, an attacker's scan would be just as invisible.
Log analysis is detection after the fact. It does not stop a request, and a quiet log does not mean nobody tried; it means nothing that you log looked unusual.
Key takeaways
- Look for patterns from one source: request rate, a burst of 500s, and repeated hits on one endpoint matter more than any single line.
- URL-decode before you search a log for SQL; in our lab a raw grep for
union selectfound nothing among 303 injection requests. - Compare response sizes, not just status codes: a fallback page answers missing paths with
200, and a blind probe's true and false answers differ only in bytes. - Add
$request_time(nginx) or%D(Apache) to your log format; time-based probes are otherwise invisible. - Remember what the access log never holds, request bodies, and log application errors safely to cover the gap.
FAQ
Can I detect SQL injection from web server logs alone?
Partly. Injection in a URL query string is logged and can be found after URL-decoding, and blind probes show up as alternating response sizes or unusually slow requests. Injection in a POST or JSON body is not in the access log at all; you see only the path and the status code, so application error logs are needed to cover it.
What is the best command to find suspicious requests in an nginx access log?
There is no single one. Start with counts per user agent, per status code and per client per second using awk, sort and uniq -c, then decode URLs and search for SQL fragments. Each check catches what the others miss, which is why they are used together.
Why does my log show 200 for paths that do not exist?
Many single-page apps and some frameworks answer unknown paths with their main page and a 200 status, so the client-side router can show its own "not found" view. In the log, those responses all share one size. Compare sizes rather than status codes to see which paths really exist.
Does a user agent like sqlmap prove an attack?
It shows that a known tool sent the request, often someone testing, possibly your own team. It is also trivial to change: sqlmap's --random-agent option picks a browser user agent instead. Treat the user agent as a hint and rely on behaviour such as rate, errors and payloads.
How do I see the response time in Apache logs?
Add %D (microseconds) or %T (seconds) to the LogFormat you use, for example at the end of the combined format string. In nginx, add $request_time to a custom log_format. Neither appears in the default combined format.
Sources
- nginx: ngx_http_log_module — the combined format and
$request_time - nginx: ngx_http_realip_module —
set_real_ip_from,real_ip_header - Apache HTTP Server 2.4: Log files — the Combined Log Format
- Apache HTTP Server 2.4: mod_log_config —
%Dand%T - sqlmap usage — default user agent and
--random-agent - ffuf — the content discovery tool used in the lab
- MITRE ATT&CK T1595.003: Wordlist Scanning
- OWASP Top 10 2025: A09 Security Logging and Alerting Failures
- OWASP Logging Cheat Sheet
- OWASP SQL Injection Prevention Cheat Sheet
Practise the attacking side on CyberGym, or test your own site with HackerGPT and then find the run in your own logs.