TL;DR: An AppMap state graph shows each state of a web app as a node (a page, a login screen, a dead end) and each action that moves between states as an edge. Read it boundary first: find the login pages, list the states that sit behind them, and test whether the server, not just the page, enforces each boundary. Dead ends and states the crawl never reached are your to-do list, not noise.
This guide is for learners and app owners who have a state graph in front of them, from AppMap or drawn by hand, and want to know what to do with it. You will learn what the graph's nodes, edges and filters mean, what a node's details tell you, and how to turn the graph into an ordered list of tests. The worked example uses CyberGym, a legal practice target, and checks by hand what the graph should show. AppMap is part of CTF Mode, and the short video below shows its graph, filters and node details in action.
Map and test only apps you own or have written permission to test. If you want the wider method first (page states, endpoints and auth as three layers), read Map a web app's attack surface before you test it. This article starts where that one ends: the graph exists, and you have to read it.
What is an application state graph?
An application state graph is a map of the states a web app can be in and the actions that move a user between them. A node is a state: a page as a particular user sees it, a login screen, an error page. An edge is an action: a click, a form submit, a login. The same URL can be several nodes, because a page rendered for a visitor and for an admin are different states.
The point of drawing an app this way is that it shows paths. A list of URLs tells you what exists; a graph tells you how a user, or an attacker, gets from the home page to the admin panel, and which step is supposed to stop them.
What does AppMap's graph show?
AppMap shows the crawled app as an interactive graph of pages, login screens and dead ends, with the relationships between them as edges. In the video's run the graph holds 533 nodes and 1,063 relationships, which is why the reading tools matter more than the picture:
- Filters narrow the graph to login pages, application states or dead ends.
- Search jumps to any node you are interested in, such as
adminorreset. - Full screen lets you follow every relationship across the app.
- Node details open when you click a node: the URL, the authentication status, the interactive elements on the page, the page states, the XPaths and click actions used to reach them, and full element properties.
Those details are what make the graph actionable. The authentication status tells you which side of the login boundary a state is on; the click actions tell you exactly how to reproduce the path to it.
How do I read a state graph to plan testing?
Read it in four passes, each producing a short list of tests.
- Find the boundaries. Filter to login pages. Every edge out of a login page crosses a boundary, and everything on the far side is a state that should require something: a session, a role, ownership of an object.
- List the guarded states and ask who enforces the guard. For each state behind a boundary, open its details and note the API calls it makes. The question is not "does the page refuse me?" but "does the server refuse the request behind the page?". A boundary drawn only in the browser is a boundary you can walk around.
- Read the dead ends. Filter to dead ends. A dead end is a state with no way forward: an error page, a refusal, the end of a flow. Some are harmless. Others mark exactly where an access check fired, which tells you where the checks are, and so where to look for the one that is missing.
- Note what is not there. States reachable only after a specific action, or only for a role the crawl did not have, may be missing. The AppMap page says the same: no map finds every endpoint. Write the gaps down; they are the next things to explore by hand.
Then order the list: boundaries the server does not enforce first, object-level checks (one user's data reached with another user's session) second, everything else after.
A worked example: CyberGym's login and role boundaries
CyberGym runs OWASP Juice Shop, a single-page Angular app. Its route table ships in its JavaScript bundle, so you can see by hand the boundaries a crawl should find. We ran these checks on 2 November 2026.
Step 1: find the guarded routes
Angular protects routes with guards declared as canActivate on each route (Angular, Route guards). Pull the guarded ones out of the bundle:
curl -s https://cybergym.hackergpt.app/main.js \
  | grep -o 'path:"[a-zA-Z0-9/:-]*",component:[A-Za-z_$]*,canActivate:\[[A-Za-z_$]*\]'
path:"administration",component:ur,canActivate:[ie]
path:"accounting",component:Vl,canActivate:[re]
path:"address/select",component:Is,canActivate:[Q]
path:"address/saved",component:Ps,canActivate:[Q]
path:"address/create",component:Re,canActivate:[Q]
path:"address/edit/:addressId",component:Re,canActivate:[Q]
path:"deluxe-membership",component:cd,canActivate:[Q]
Seven of the app's routes carry a guard. The names are minified, so read the guards themselves:
curl -s https://cybergym.hackergpt.app/main.js | grep -o 'canActivate(){[^}]\{0,130\}'
canActivate(){return!!localStorage.getItem("token")||(this.forbidRoute("UNAUTHORIZED_ACCESS_ERROR"),!1)
canActivate(){const e=this.loginGuard.tokenDecode();return!(!e?.data||"admin"!==e.data.role)||(this.loginGuard.forbidRoute(),!1)
canActivate(){const e=this.loginGuard.tokenDecode();return!(!e?.data||"accounting"!==e.data.role)||(this.loginGuard.forbidRoute(),!1)
That gives three boundaries: a login guard (is there a token in the browser's storage?) and two role guards (does the decoded token say admin or accounting?). When a guard refuses, forbidRoute makes the router show the /403 page, which is the dead end a crawl records. It navigates with skipLocationChange, so the address bar keeps the refused URL while the page shows the refusal.
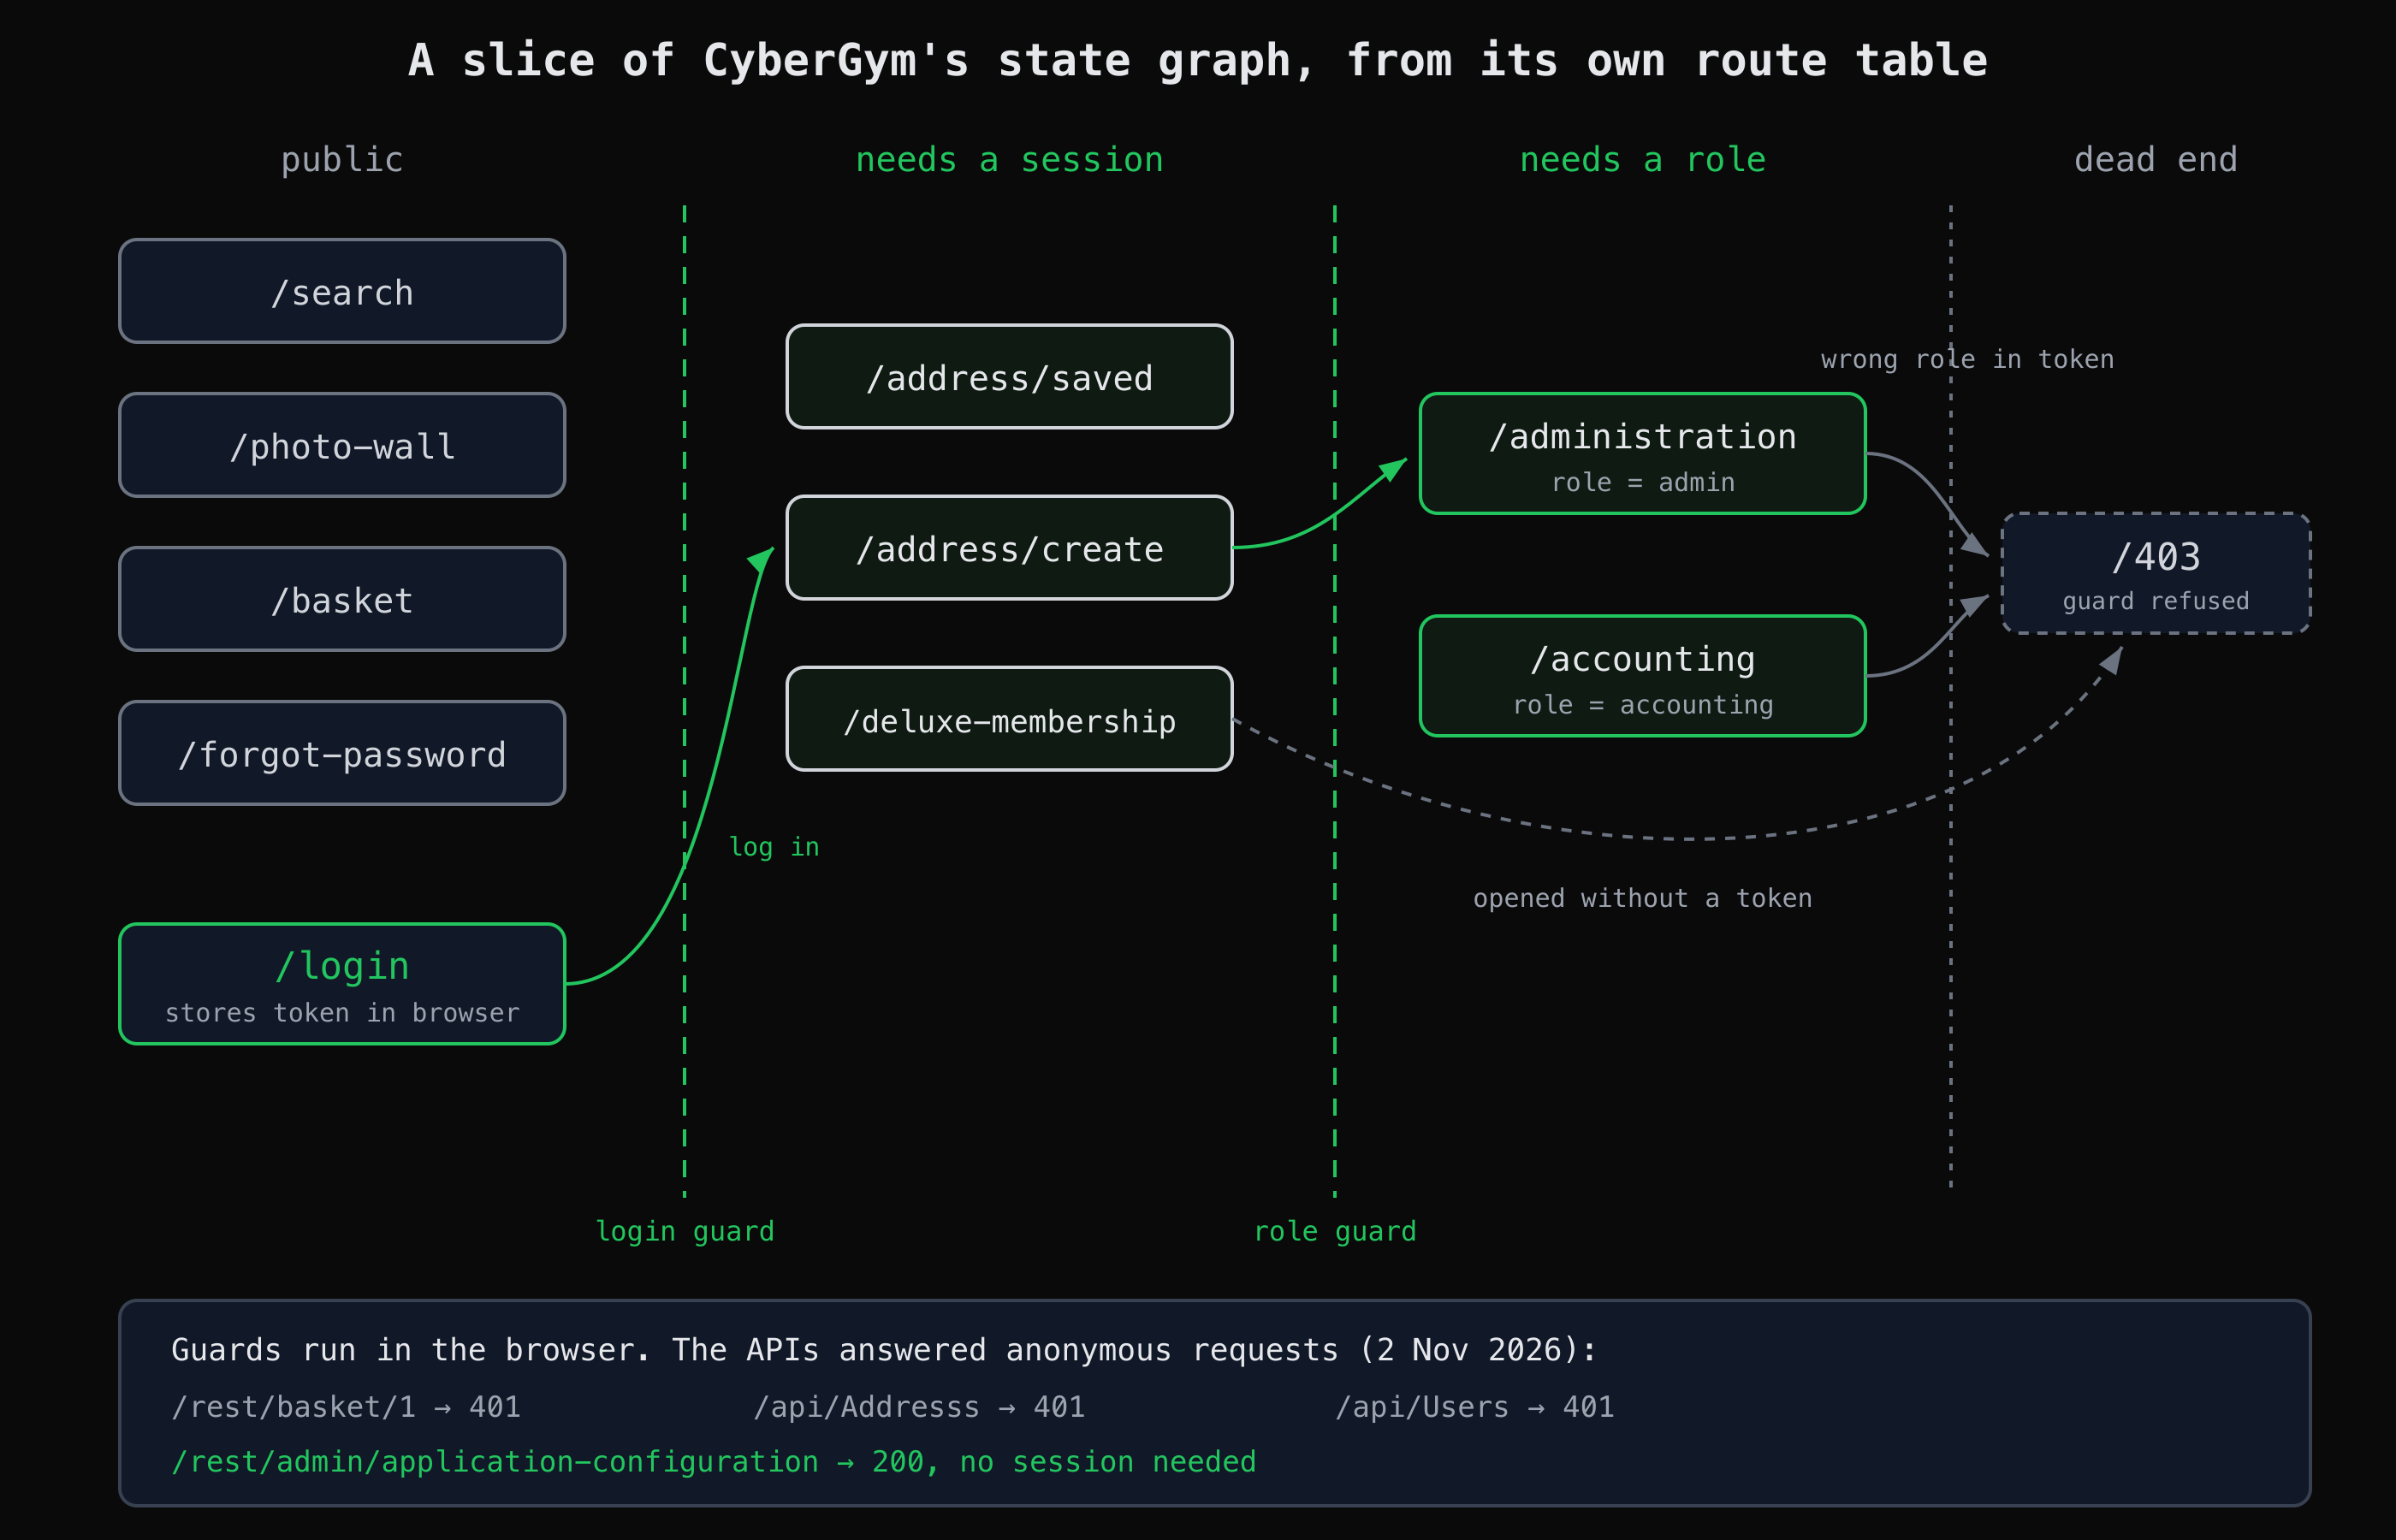
Drawn by hand from the route table in CyberGym's own JavaScript bundle and the API status codes we observed. AppMap builds the same kind of graph by crawling.
Step 2: ask whether the server enforces each boundary
All three guards run in the browser and only read the token the browser holds. Angular's own documentation warns that all JavaScript in the browser can be modified by the user, so authorization must also be enforced on the server (Angular, Route guards). So the test is the API behind each state, sent with no session at all:
for p in /rest/basket/1 /api/Addresss /api/Users /rest/admin/application-configuration; do
  printf '%-40s %s\n' "$p" "$(curl -s -o /dev/null -w '%{http_code}' "https://cybergym.hackergpt.app$p")"
done
/rest/basket/1                           401
/api/Addresss                            401
/api/Users                               401
/rest/admin/application-configuration    200
The address and user APIs refuse an anonymous request, so the server does enforce those boundaries. The endpoint under /rest/admin/ answers anonymously with the app's configuration. That one line is a test-plan item: an "admin" endpoint that the server serves to anyone. It may be intended, but it is exactly the decision the graph makes you look at, and the kind of check the OWASP testing guide for bypassing authorization describes: request each protected resource without the credentials it should require.
Step 3: read what is on the public side
Notice what is not guarded. /basket has no route guard at all, yet its API returns 401 without a session. Here the page boundary is missing and the server boundary is present, the reverse of the admin endpoint above. A graph that shows the page as public and its API call as authenticated tells you the check lives on the server, which is where it belongs. The next test is the harder one: with your session, does the server check that the basket is yours? That is the object-level question walked through in the IDOR example on CyberGym.
What should I do with the graph after testing?
Keep it as the record of what you tested and what you did not. For each boundary, note the result: enforced by the server, enforced only in the browser, or not tested yet. Run the map again after each release and compare: a new node behind no boundary, or a new edge that skips one, is where the next review starts. Broken access control is first in the OWASP Top 10:2021, and a graph that makes boundaries visible is a direct way to look for it.
For a full first test of your own site after the map, see how to pentest your own website.
Key takeaways
- Read the graph boundary first: filter to login pages, then list every state behind each one.
- A route guard in the browser is a convenience, not a control. Test the API behind every guarded state without a session.
- Dead ends show where checks fired; use them to find the boundary where a check is missing.
- Open node details for the authentication status and the click path, so every test is reproducible.
- Treat states the crawl did not reach as an explicit to-do list, and re-map after each release.
FAQ
What is a dead end in an application state graph?
A dead end is a state with no way forward: an error page, an access refusal, or the last step of a flow. On CyberGym, a route guard that refuses you gets the /403 page, a dead end. Dead ends are worth reading because they show where the app's checks fire.
Is a client-side route guard a security control?
No. A route guard decides what the browser renders, and the user controls the browser. Angular's documentation says to always enforce authorization on the server as well. Test the API behind a guarded page directly; if it answers without the right session, the guard was the only check.
Does a state graph find every page of an app?
No. A crawl reaches the states it can get to with the sessions and roles it has, and states that appear only after a specific action can be missed. Treat the graph as an inventory to test against, with its gaps written down.
Sources
- Angular — Route guards
- OWASP Top 10:2021 — A01 Broken Access Control
- OWASP WSTG — Testing for Bypassing Authorization Schema
- OWASP Juice Shop
Map your own app with HackerGPT, or practise reading a graph on CyberGym first.